Lab-Native Interface and Smarter Workflows
Qvios is built for laboratory teams, not generic project management. Units, labware, and workflow views feel familiar from day one, so scientists can move faster with less training.
Features
Explore how Qvios helps laboratory teams standardize protocols, track samples, execute experiments, and organize structured scientific data in one platform.
Qvios is built for laboratory teams, not generic project management. Units, labware, and workflow views feel familiar from day one, so scientists can move faster with less training.
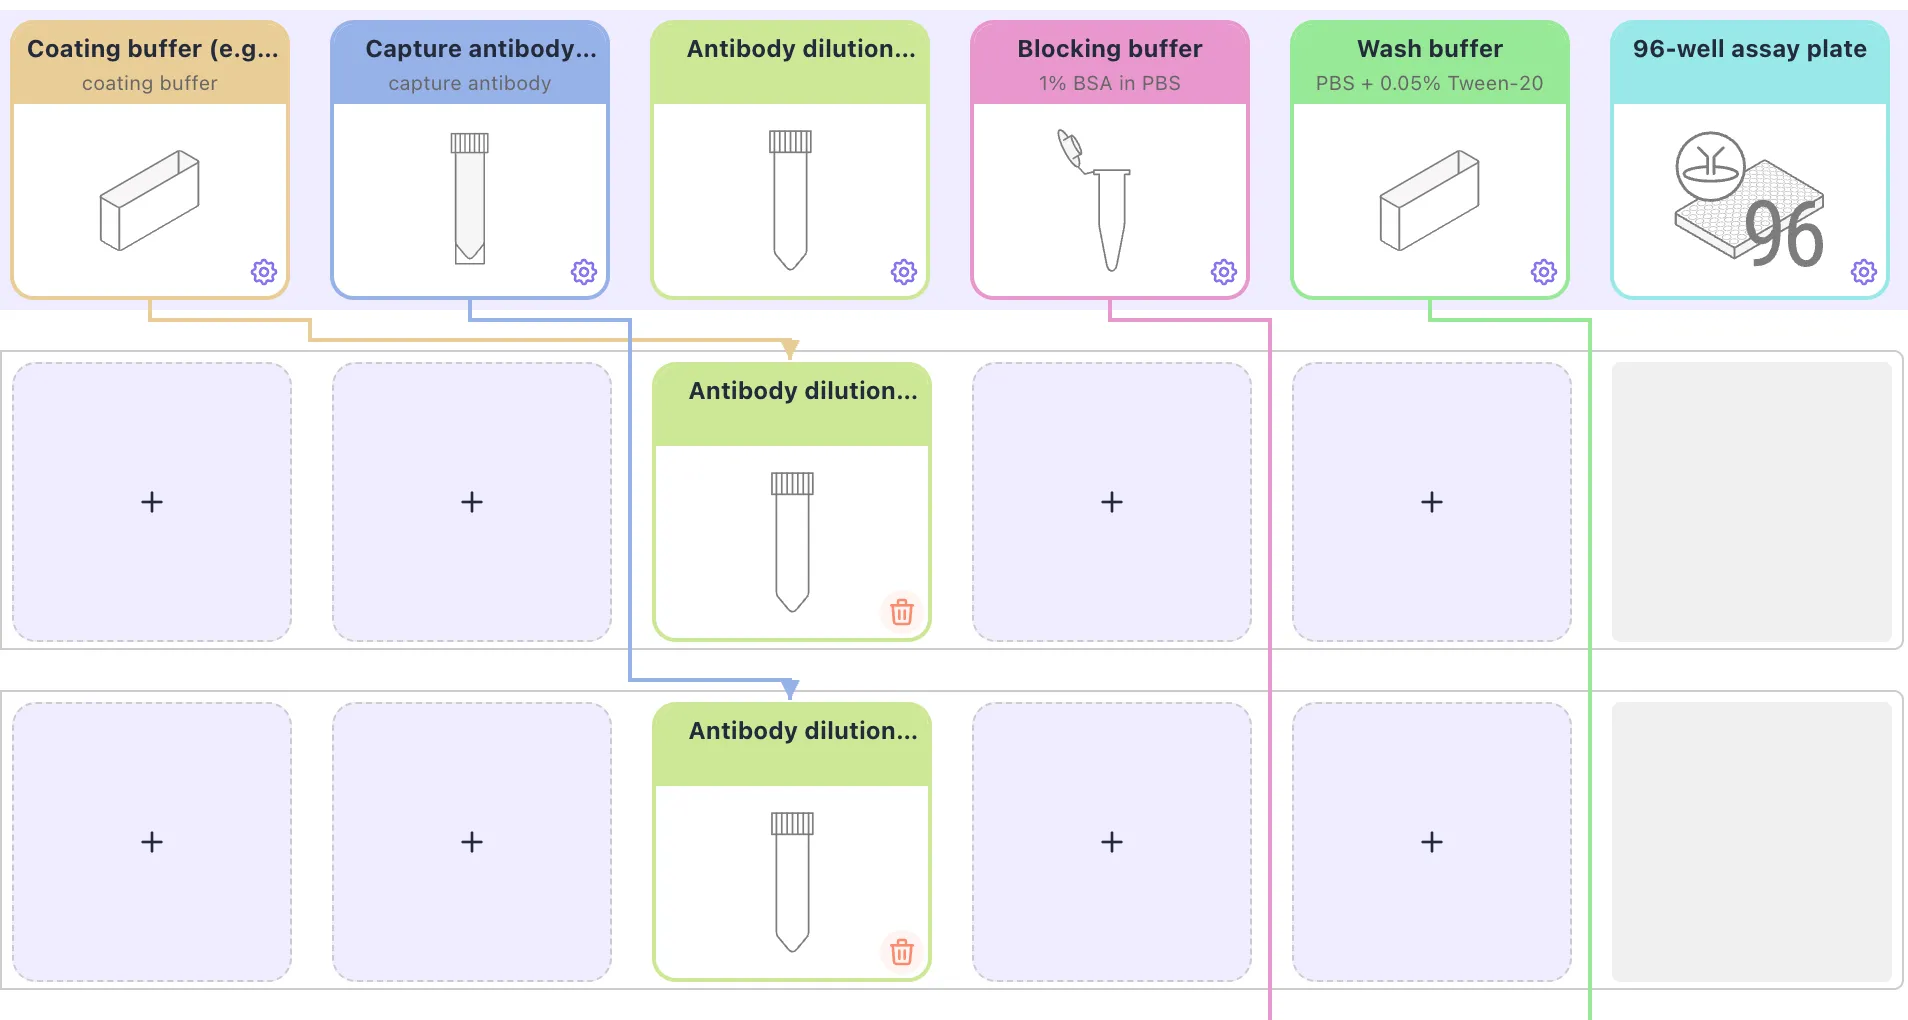
Save protocol steps, procedures, and labware setups as reusable building blocks. Standardize SOPs once, then assemble new workflows in minutes without rewriting recurring methods.
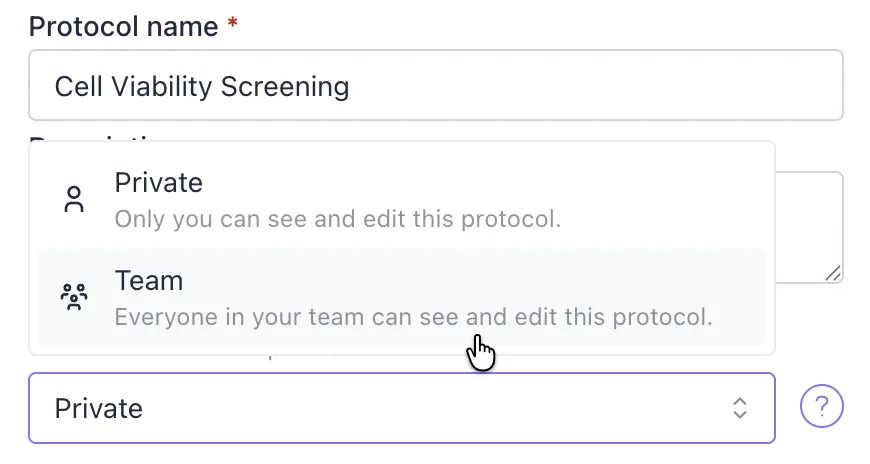
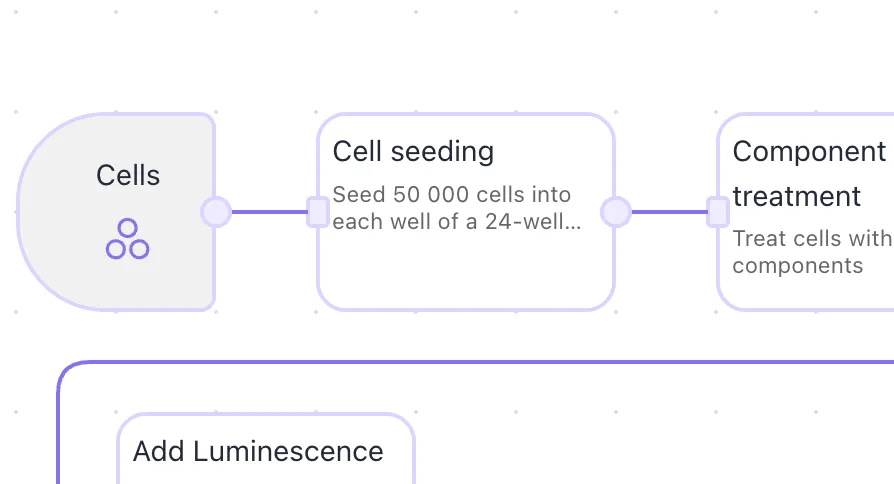
Share workflows across teams, coordinate experiment execution, and onboard new lab members with consistent instructions. Lab managers get one workspace to oversee projects, status, and handoffs.
Set sample counts and run variables once, and Qvios automatically scales protocol steps and reagent volumes. Reduce manual calculations, avoid over-prep, and cut experiment waste and cost.
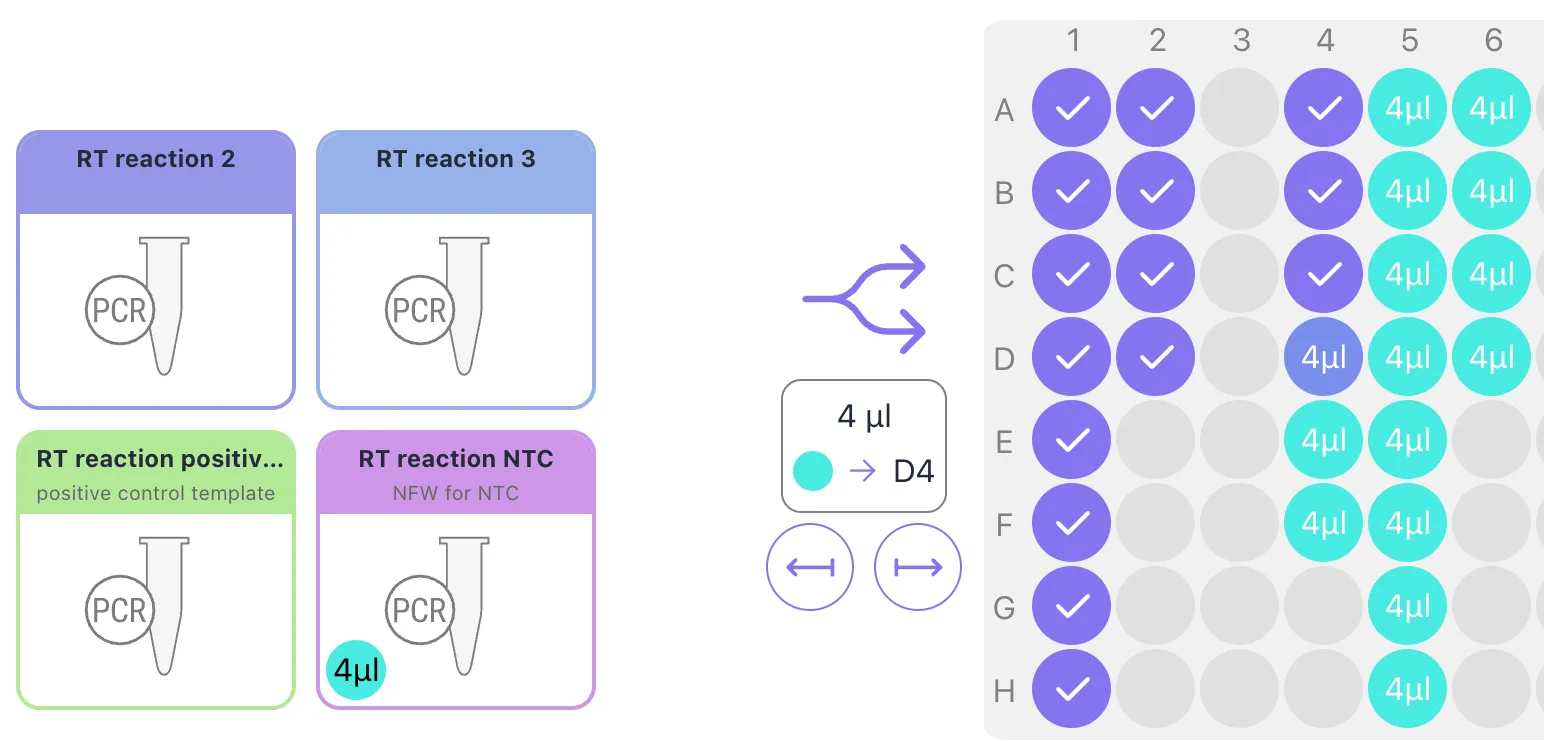
Run experiments with integrated pipetting maps, timers, and step-by-step context. Capture execution records and upload results directly into the same workflow for complete traceability.
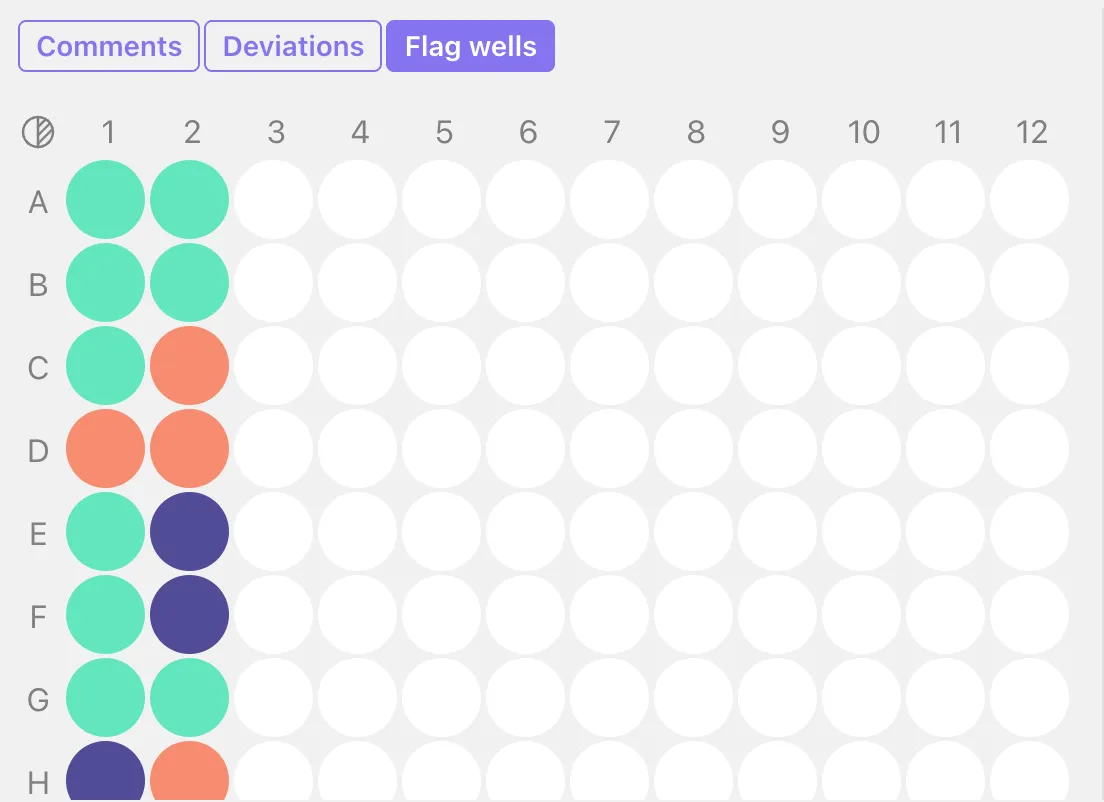
Add notes, protocol deviations, and sample flags directly next to each step. Replace disconnected lab notebook entries with contextual records that are easy to review during audits and troubleshooting.
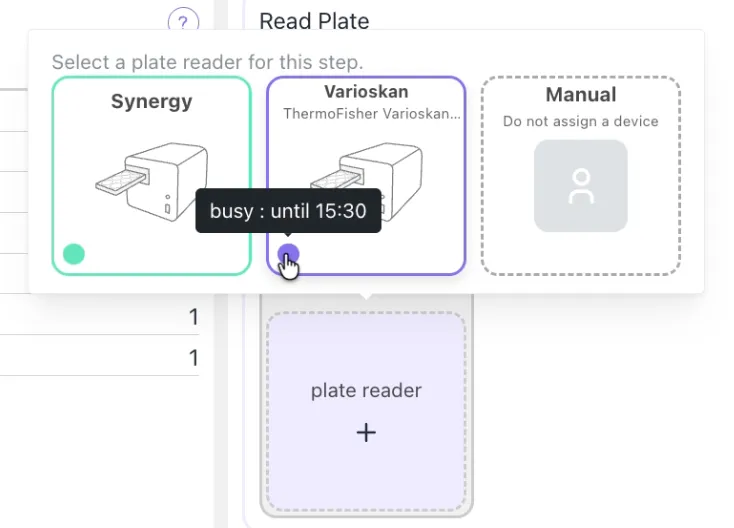
Connect instruments and existing lab systems without vendor lock-in. Generate device worklists and monitor instrument status in one interface instead of switching across multiple tools.
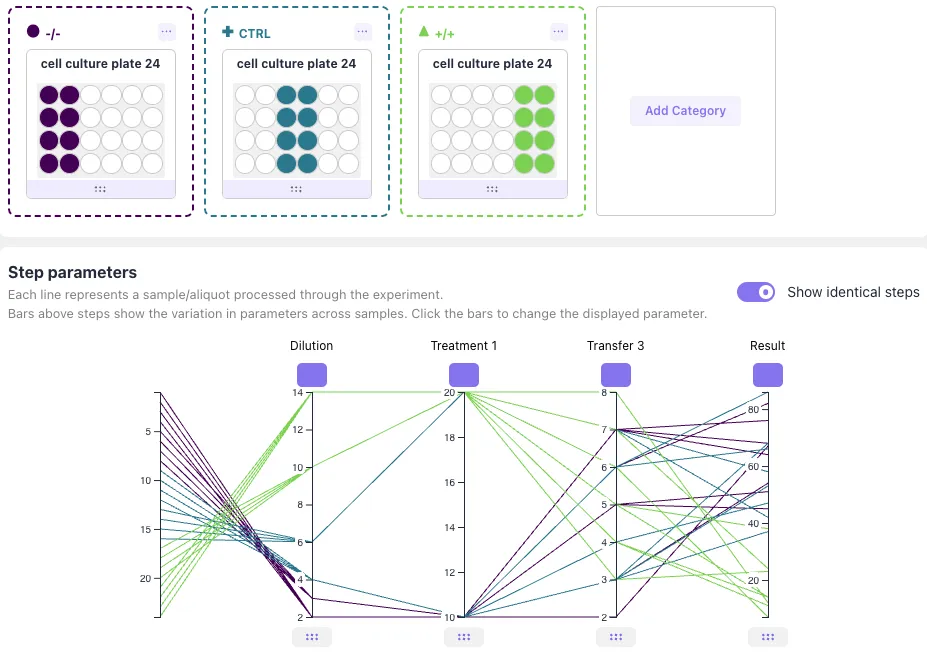
Store design parameters and execution data in a standardized format linked to samples and measurement results. Improve data integrity, simplify downstream analysis, and keep traceability ready for compliance.
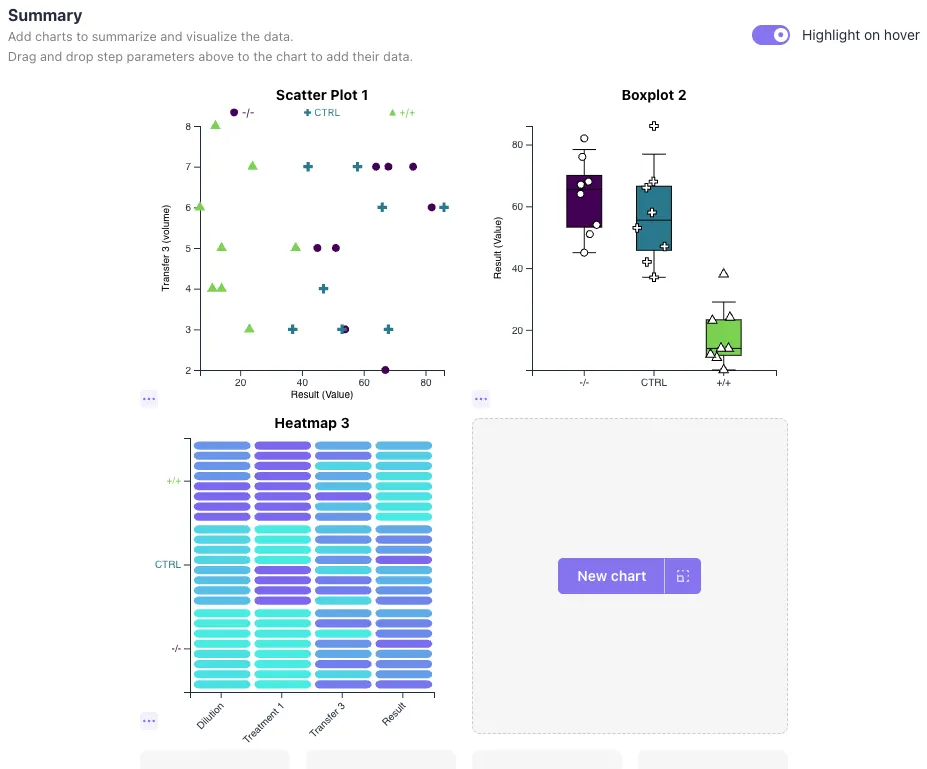
Create scientifically accurate charts directly from experimental data. Qvios helps teams produce publication-ready visuals faster while preserving links to source data and protocol context.