Quick Start: Run Your First Experiment
This guide helps you get started by running your first Qvios experiment.
Choose a protocol
Section titled “Choose a protocol”Qvios comes preloaded with a protocol. If you created an account to access a shared protocol someone else made and shared with you, it should already be in your account. If you didn’t start with a shared protocol, your account includes a default example protocol: a simple qPCR setup. If you want another starting point, you can find additional examples here.
This quick-start guide assumes you are using an existing protocol. You will learn how to create protocols from scratch in the next section.
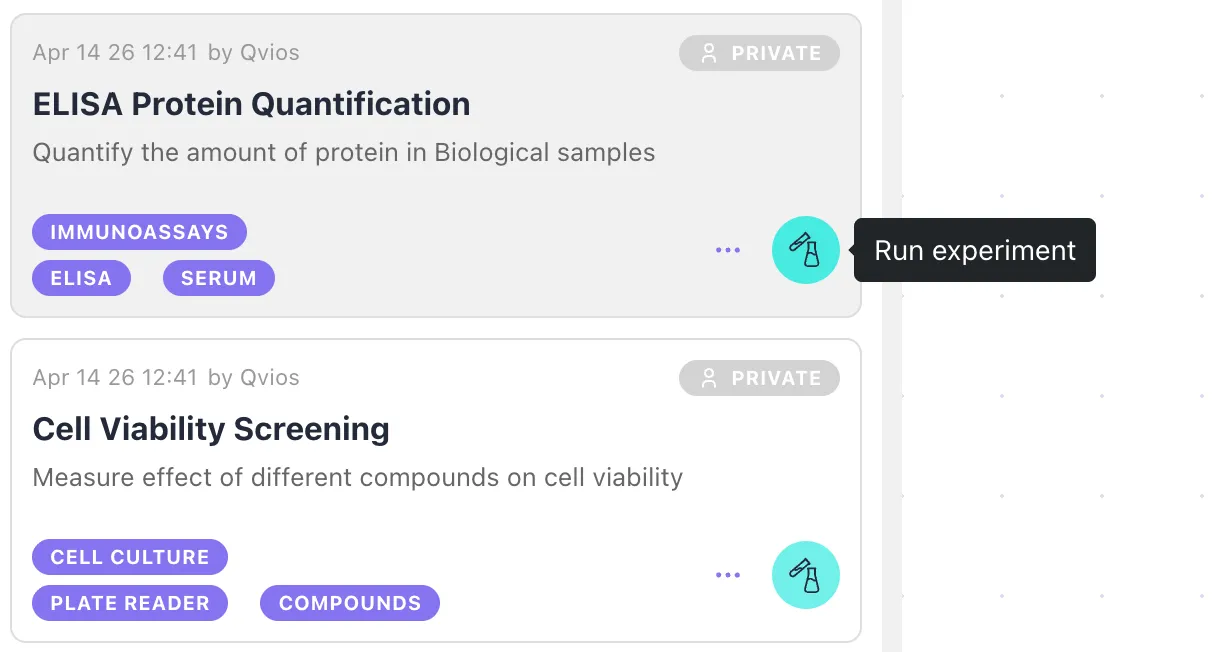
Let’s get started: Protocols are listed on the left side of the Protocols view. To run an experiment, click the “Run Experiment” button on the protocol card. This will open the preparation view.
Prepare experiment
Section titled “Prepare experiment”Before the experiment starts, you can add sample data and adjust step parameters to fine-tune the experiment.
Input sample data
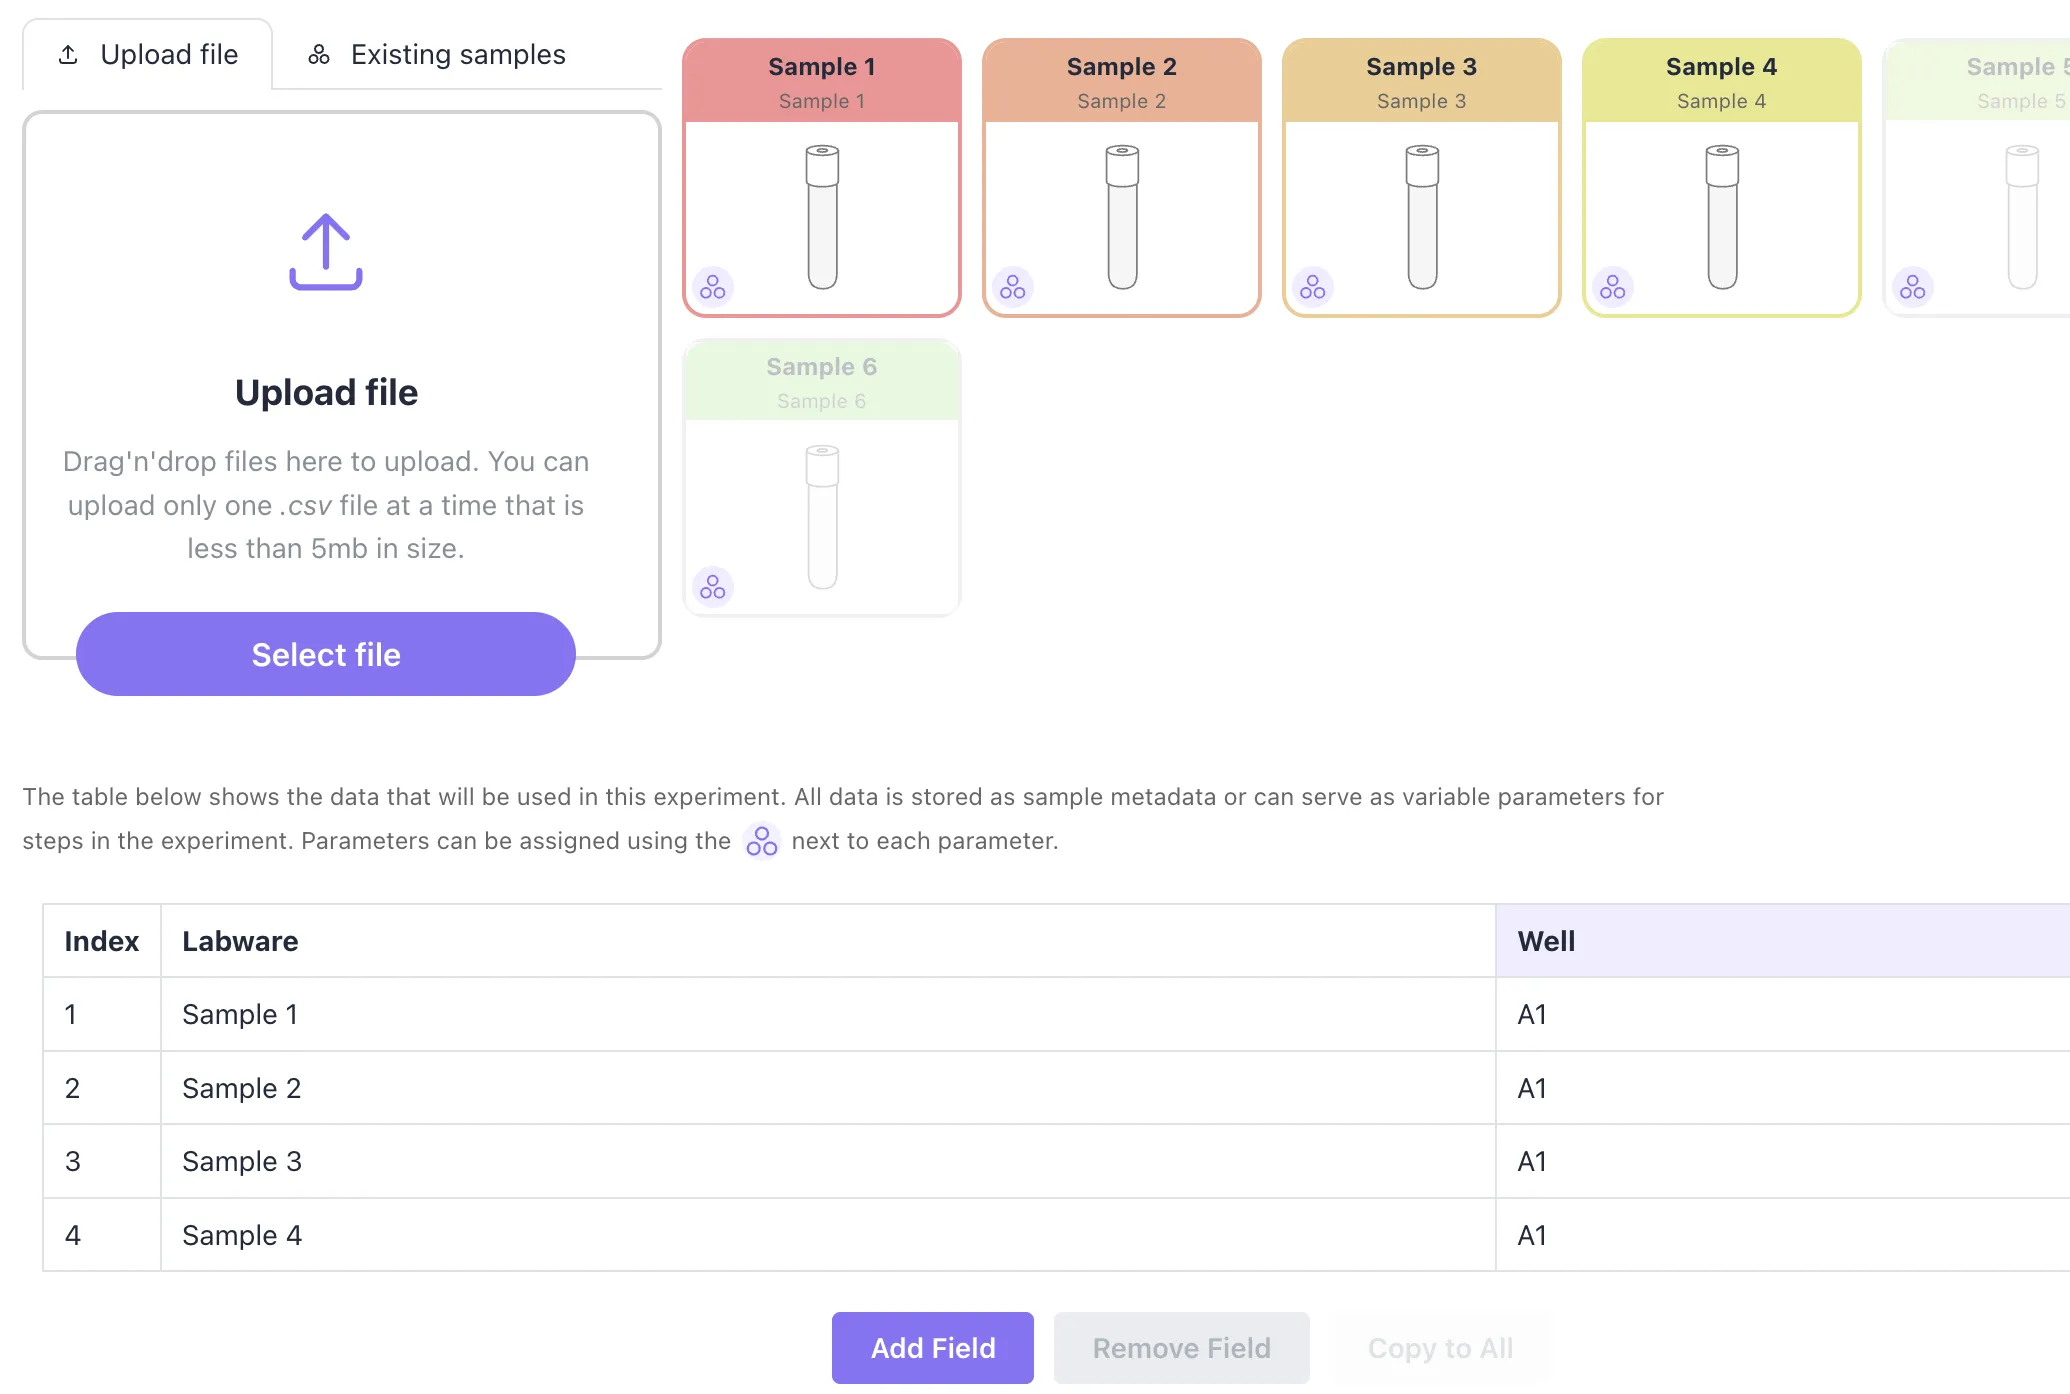
Section titled “Input sample data”Click the “Enter Sample Data” button to open the sample data window. Here, you can add any additional information and sample metadata. There are a few ways to add data here, but for the first experiment, you can click the “Add field” button and enter data manually. You can also use the labware icons or platemaps to toggle samples on and off when you are running below full capacity. Once you are happy with the sample data, click “Apply” to save changes.
Adjust step parameters
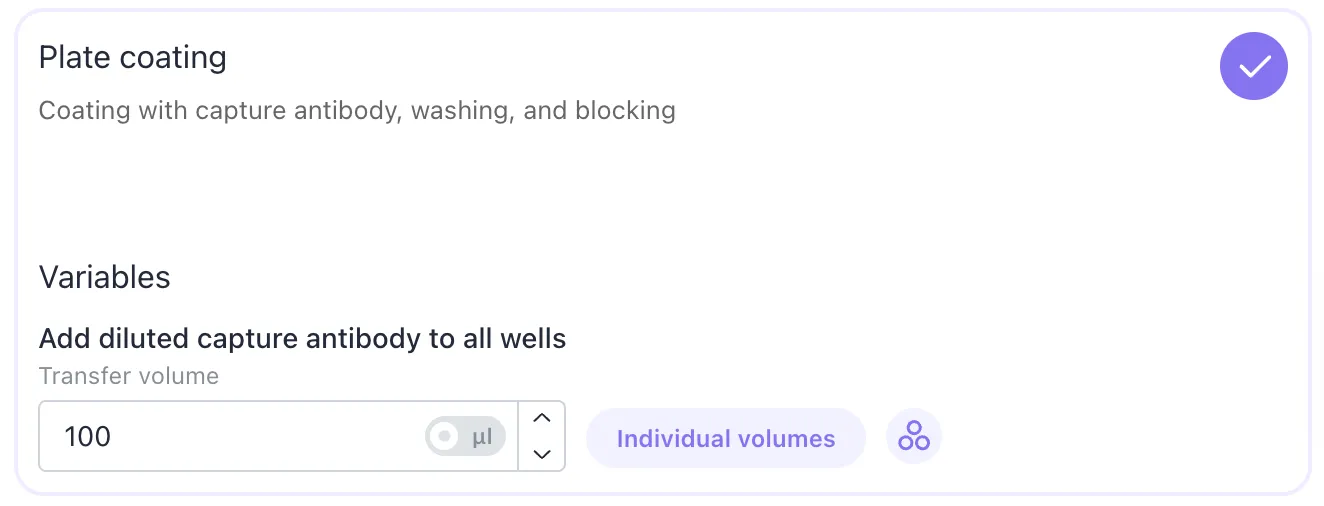
Section titled “Adjust step parameters”In the prepare view, you can also adjust step parameters. If some parameters in the protocol are set as variables, you can adjust their values here. These values will be used in the experiment in place of the default values.
Reagents and consumables
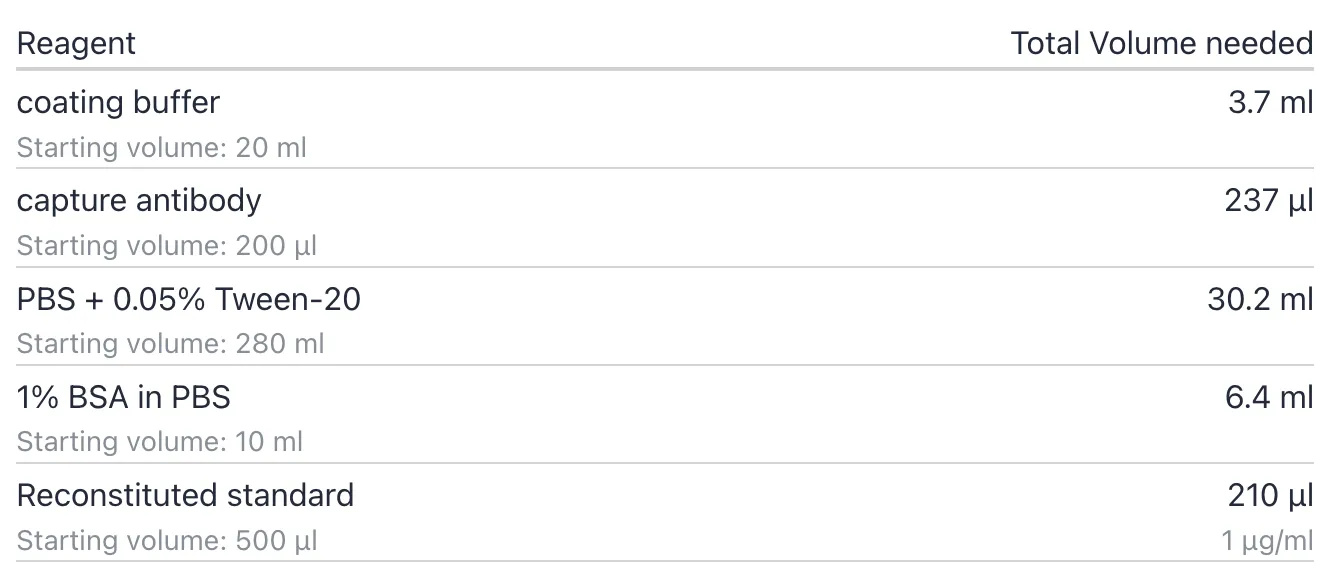
Section titled “Reagents and consumables”Qvios calculates the required reagents and consumables for the experiment. When you select samples and adjust step parameters, you can see these calculations update. They always reflect the current state you are going to run the experiment. For reagents, a dead volume specific to each labware is added to the total required volume. The dead volume for each type of labware can be adjusted in the user settings.
Run experiment
Section titled “Run experiment”Click the Execute button in the prepare view, and Qvios will generate step-by-step instructions for you. As you move between steps, your progress is automatically recorded, and you can return to where you left off by selecting the ongoing experiment from the left-hand list on the Experiment page.
Experimental steps
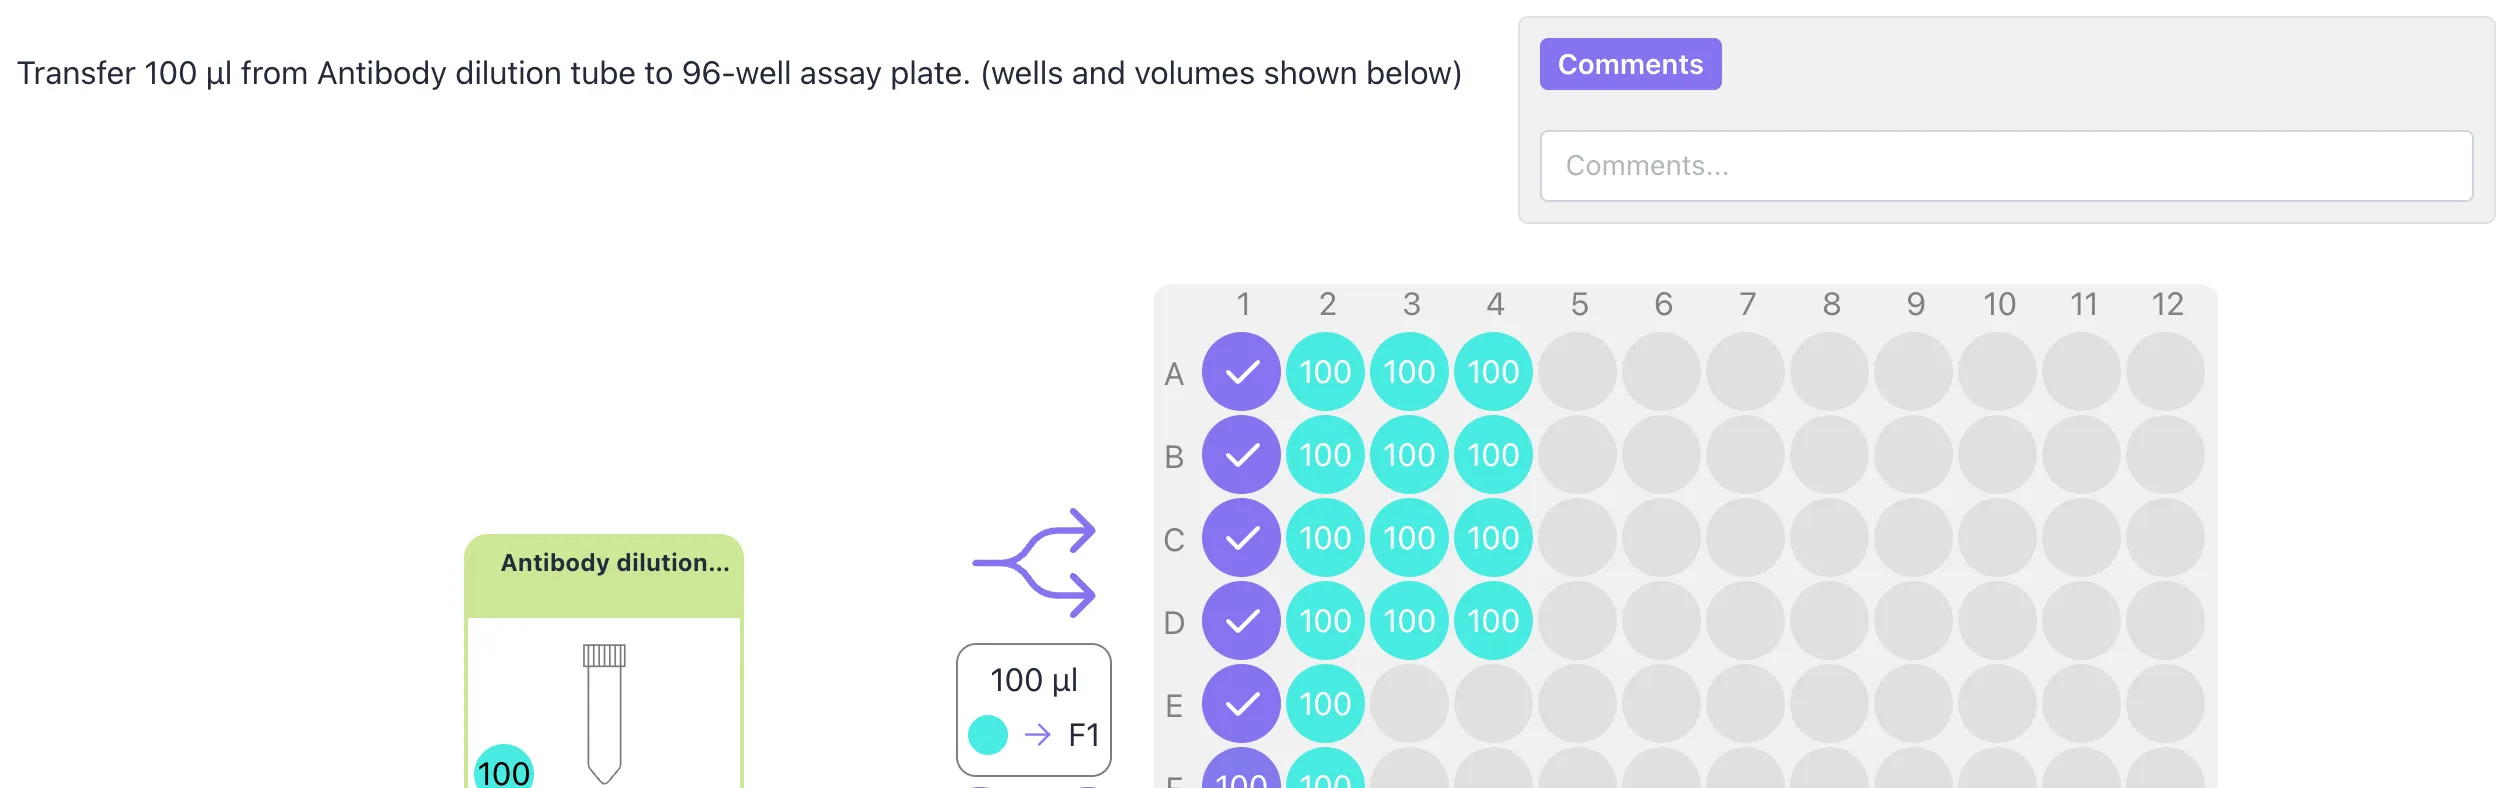
Section titled “Experimental steps”Each step includes written instructions, a helper tool based on the step type (e.g., a pipetting map for transfer steps, a timer for incubation), and a notes box where you can add your own comments, record any deviations from the instructions, and flag labware or wells. All these tools are optional, and for your convenience, you can use as many as you like.
Uploading measurement results
Section titled “Uploading measurement results”If the selected protocol contains measurement nodes, you will be prompted to upload the measurement results to the experiment. For measurement nodes, click the “Upload Results” button to open the results upload window. This is similar to the sample data window, but this time you can add measurement results for each labware or well instead of sample data. Once you have completed the entire experiment and uploaded the results, click the “Finish” button at the bottom of the navigation. This moves your experiment from the list of ongoing experiments to the finished experiments visible in the Discovery view. You have now completed your first experiment.
Discovery
Section titled “Discovery”All completed experiments are listed in the Discovery view.
Sample categories
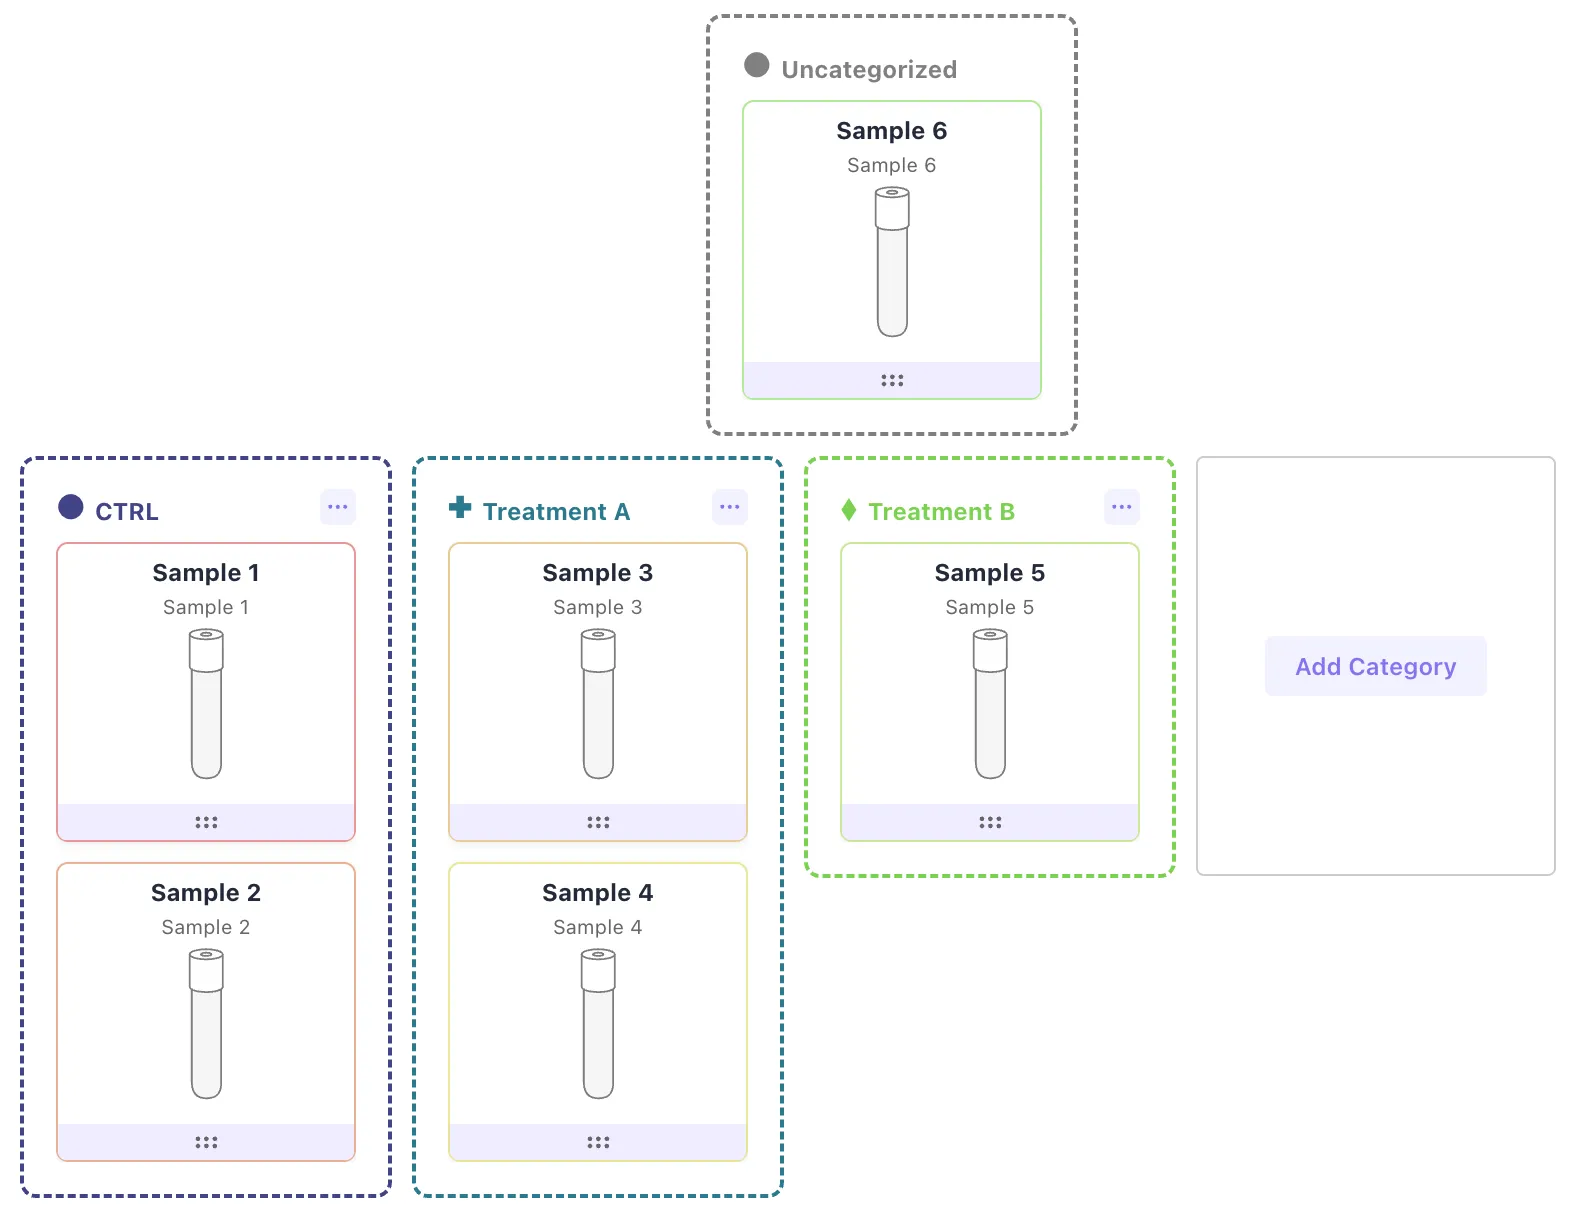
Section titled “Sample categories”Select the experiments you just finished, and the initial sample labwares will appear first. You can assign labware items to categories, and those categories will be reflected in the following visualizations.
Step parameters chart
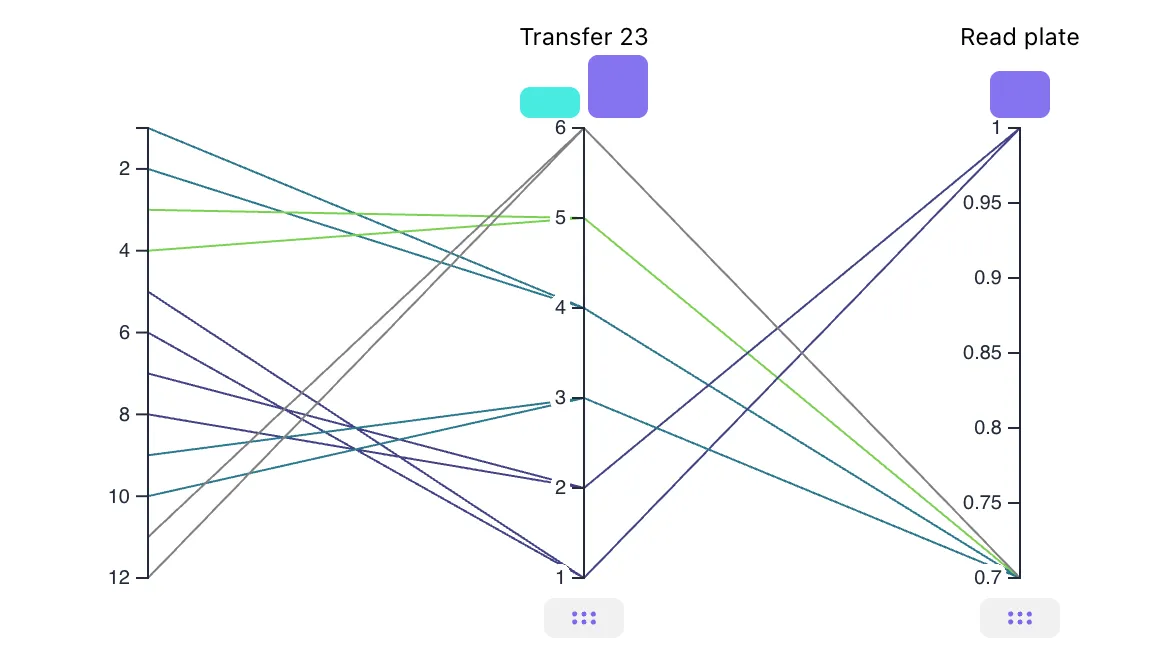
Section titled “Step parameters chart”Below the samples, there’s a step parameter chart. Each vertical line represents a step or measurement in the experiment, and the horizontal lines show your samples as they progress through those steps. If a sample is split into several aliquots at any point in the process, each aliquot will have its own line. Above each step line, one or more bars represent different step parameters. Click the bars to change which parameter the line currently represents. The height of the bar indicates relative variability within the parameter. Below each step line is a handle you can use to drag the step with the selected parameter to the summary charts.
Summary section
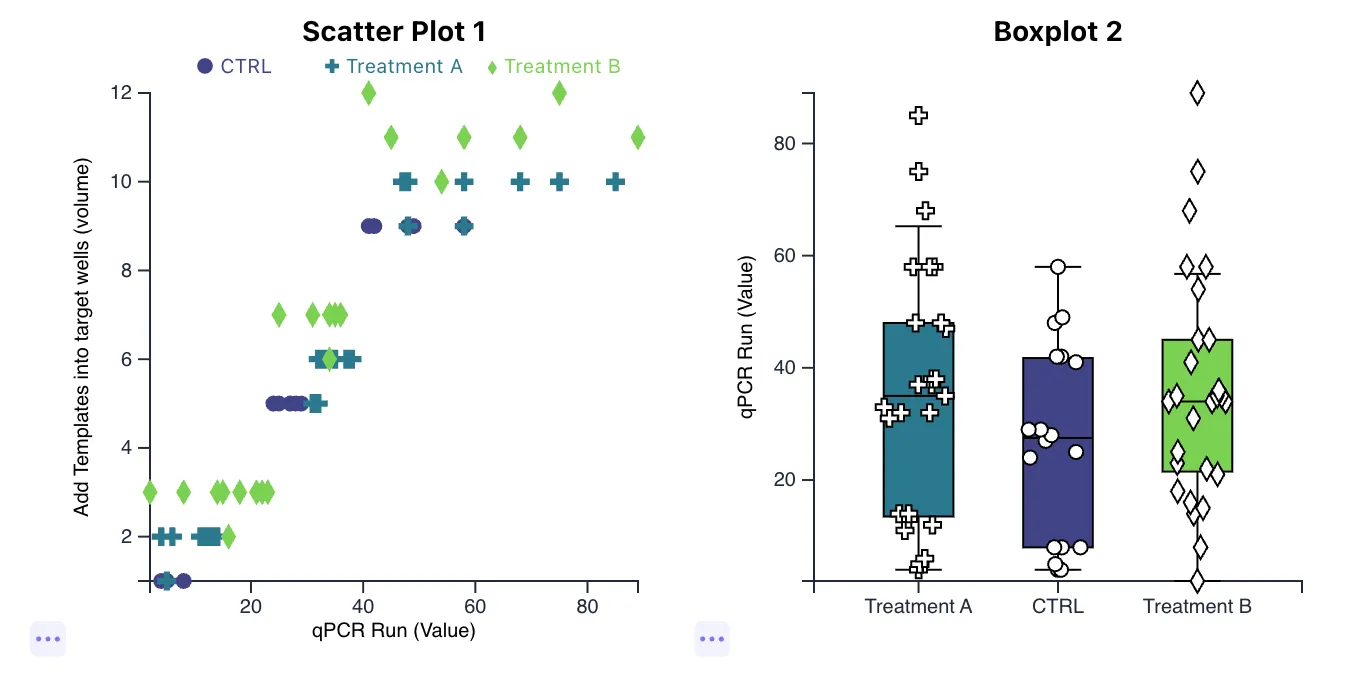
Section titled “Summary section”The summary section is at the end of the Discovery view, where you can add new charts to further visualize and highlight the most interesting parts. Add a new chart, then populate the axes with the parameters of interest by dragging them from the step parameters chart above. Some chart types allow you to add several parameters to the same axis, while others will override the data if you add another parameter. To compare several experiments, you can drag and drop parameters from different experiments into the same chart. Each chart has a “…” menu button that lets you fine-tune it individually.